
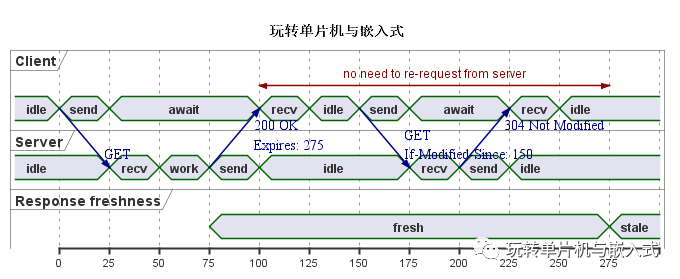
大家画时序图都在使用什么工具?上图中的这个图片,有没有感觉很复杂?如果让您用Visio画图需要画多长时间?
本文共享一个VScode中可以产生各种图片的小插件“PlantUML”。
01
先说
@startumlTitle 玩转单片机与嵌入式clock "CLK" as C0 with period 1
binary "INTPUT" as Bbinary "RESET" as C@0B is highC is high@1C is low@2.5C is high@4B is low@6B is high@8B is low@8B is high@8B is low@8C is low
@enduml
使用vscode打开新建的txt文件,选择【ctrl shift P】快捷键,选择【预览光标位置图表】

就可以预览到上面代码产生的时序图。
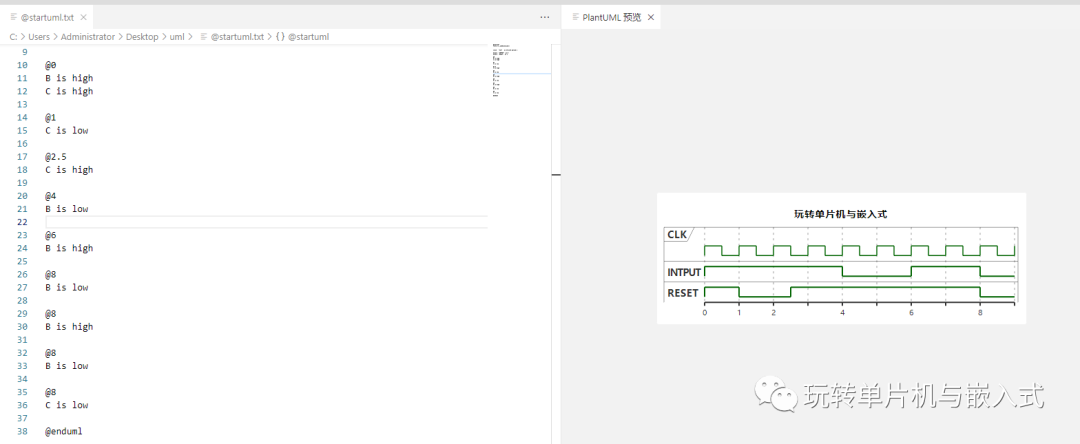
右侧的图片也可以进行保存,或者直接使用vscode的快捷键导出图表。
是不是很神奇?
下面是主图页面中时序图的脚本文件:
@startuml
Title 教你在VScode中用脚本语言画时序图。concise "Client" as Clientconcise "Server" as Serverconcise "Response freshness" as Cache
Server is idleClient is idle
@Client0 is sendClient -> Server@ 25 : GET 25 is await 75 is recv 25 is idle 25 is sendClient -> Server@ 25 : GETIf-Modified-Since: 150 25 is await 50 is recv 25 is idle@100 <-> @275 : no need to re-request from server
@Server25 is recv 25 is work 25 is sendServer -> Client@ 25 : 200 OK
Expires: 275 25 is idle 75 is recv 25 is sendServer -> Client@ 25 : 304 Not Modified 25 is idle
@Cache75 is fresh 200 is stale@enduml
图片如下
PlantUML使画图变得如此简单。










暂无评论